SberIndex statistical portal Chulakov
This work
in other
nominations
UX, UI & Journey Design
Task
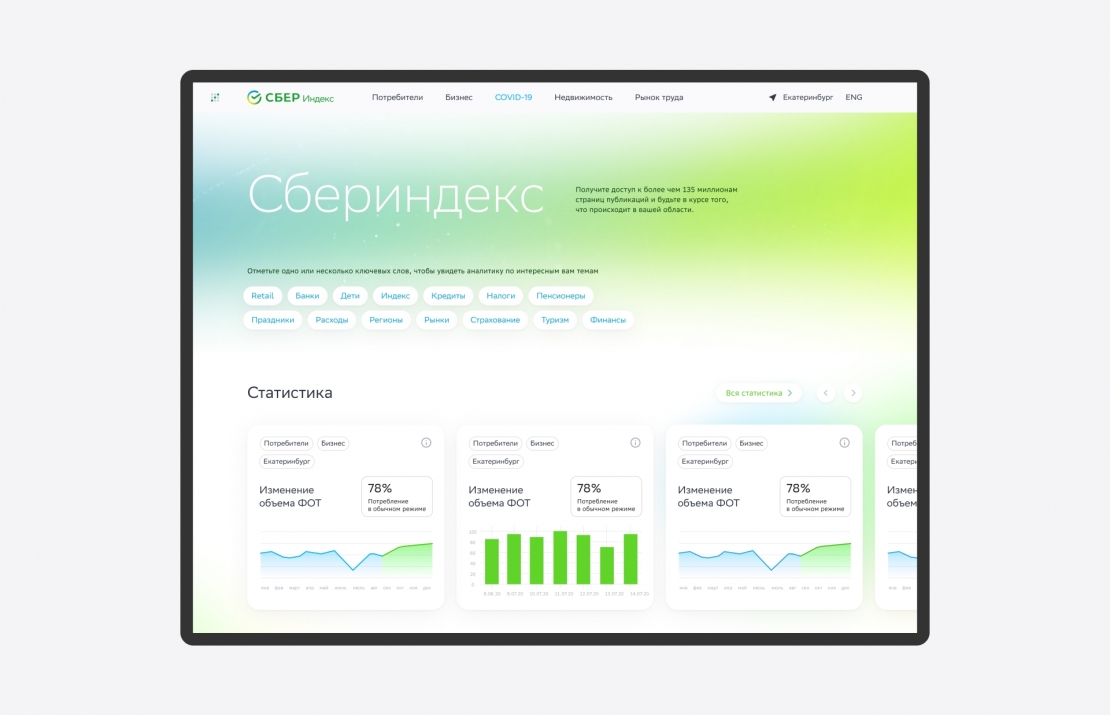
We launched the SberIndex.ru resource in April that reflects the answers to the most important questions about life in the era of COVID-19. Our task was to improve the initial resource and make it a full-fledged and convenient statistical portal. And it's easy to add new data to. For example, posting a new graphic from the moment of uploading is 5 minutes.
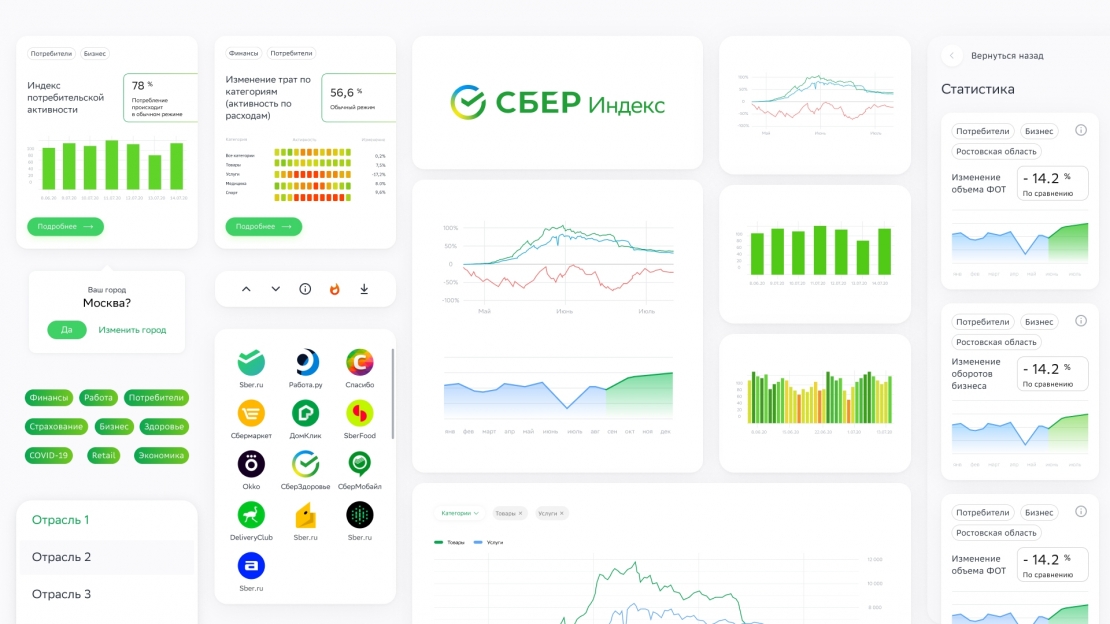
Ideas and solutions
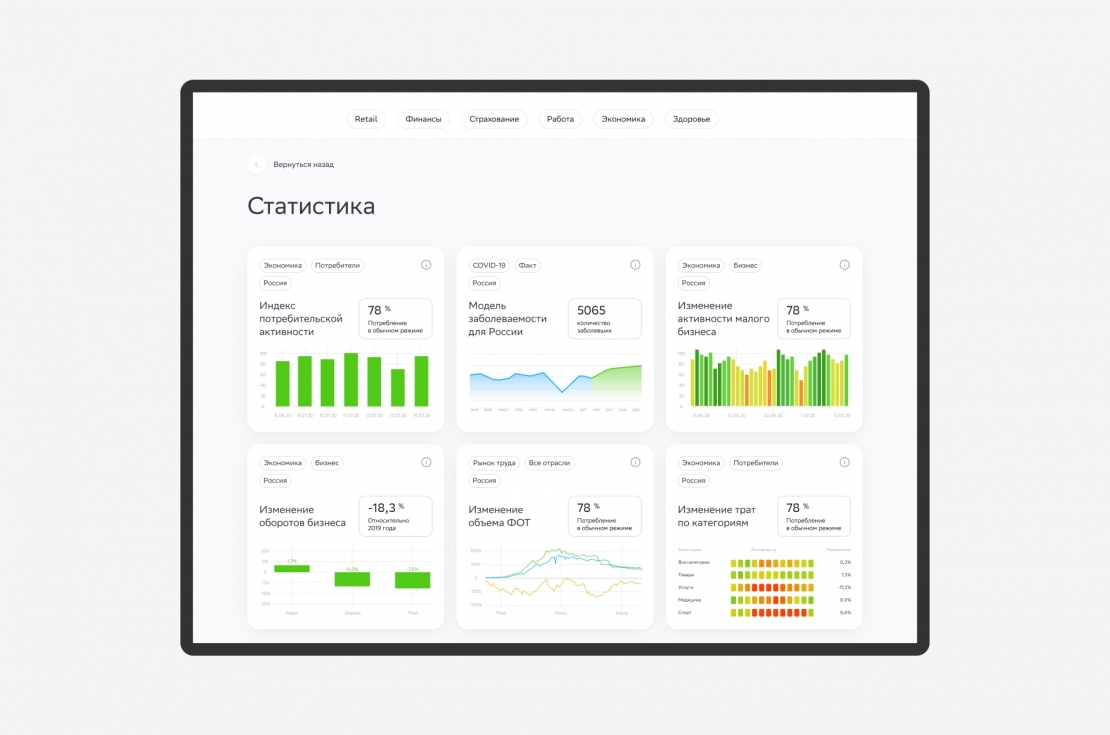
The concept of the entire website consists of flexible customization of the displayed content by the consumer. With the help of search and auto-fill of form fields, the user selects interesting topics and the portal displays materials based on these topics. We are always thinking of our users and trying to make their life effortless, especially when it comes to reading graphics. It is easier for people to perceive and retain information in a graphic format. Thanks to this type of presentation, even complex statistics can be quickly dealt with. Therefore for the updated version of the portal, we have worked out a variety of graph types: — in miniature — for statistics preview; — detailed version — for a more careful study on the statistics page itself. A dynamic card has been created for each type of statistics where its content changes depending on the topics selected by the user. Additionally, you can click on any card and fall into a separate page with a corresponding type of statistics. Here you can choose - to assess the situation for a specific city or country as a whole. Dark side. Being more precisely, the dark mode of the portal design. Very soon users will be able to choose which side to switch to.